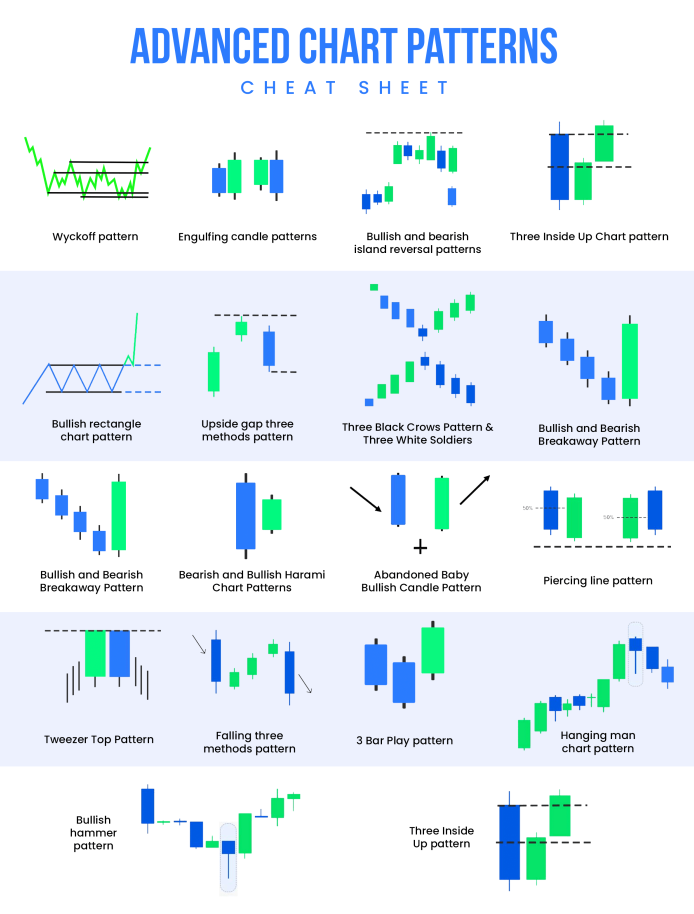
When it comes to trading, understanding candlestick patterns is like having a secret weapon in your arsenal. Whether you’re a beginner or have some experience, a candlestick patterns cheat sheet can be your best friend in navigating the markets. In this post, I’ll walk you through what candlestick patterns are, why they’re important, and how you can use a cheat sheet to improve your trading decisions.
What Are Candlestick Patterns?
Candlestick patterns are visual representations of price movements in the market. Each “candlestick” shows four key pieces of information: the opening price, closing price, highest price, and lowest price during a specific time frame. The body of the candlestick represents the difference between the opening and closing prices, while the wicks or shadows show the highs and lows. These patterns help traders understand market sentiment and make predictions about future price movements. By recognizing these patterns, you can make more informed decisions on when to buy or sell.
Why You Need a Candlestick Patterns Cheat Sheet
The financial markets can be overwhelming, especially with the countless patterns that traders need to recognize. This is where a candlestick patterns cheat sheet comes in handy. A cheat sheet is a quick reference guide that lists the most common and important candlestick patterns, along with what they indicate about the market.
Having a cheat sheet allows you to:
- Quickly Identify Patterns: Instead of memorizing every pattern, you can glance at your cheat sheet and make a quick decision.
- Reduce Mistakes: By having a reference, you’re less likely to misinterpret a pattern, which can help you avoid costly errors.
- Improve Speed: The faster you can recognize patterns, the quicker you can react to market changes.
Key Candlestick Patterns to Know
Here are some of the most essential candlestick patterns that should be on your cheat sheet:
1. Doji
A Doji candlestick has a very small body, indicating indecision in the market. It’s a signal that the current trend may be about to reverse.
2. Hammer
The Hammer is a bullish reversal pattern that appears at the bottom of a downtrend. It has a small body and a long lower wick, showing that buyers are stepping in to push prices up.
3. Engulfing Pattern
There are two types: Bullish Engulfing and Bearish Engulfing. A Bullish Engulfing pattern signals a potential upward reversal, while a Bearish Engulfing pattern suggests a downward reversal. The second candle completely engulfs the previous one, indicating a strong shift in market sentiment.
4. Morning Star
The Morning Star is a bullish reversal pattern that typically appears at the bottom of a downtrend. It consists of three candles: a long bearish candle, a small-bodied candle (which can be bullish or bearish), and a long bullish candle.
5. Shooting Star
A Shooting Star is a bearish reversal pattern with a small body and a long upper wick. It usually appears at the top of an uptrend, indicating that the market may be about to turn downward.
How to Use Your Candlestick Patterns Cheat Sheet
To get the most out of your cheat sheet, keep it easily accessible whenever you’re analyzing charts. Here’s how you can use it effectively:
- Spot a Pattern: When you notice a pattern forming, refer to your cheat sheet to confirm what it might indicate.
- Check the Trend: Always consider the overall trend of the market. A pattern is more reliable when it aligns with the broader trend.
- Make Your Move: Based on the pattern and your analysis, decide whether to buy, sell, or hold your position.
Final Thoughts
Candlestick patterns are a powerful tool in any trader’s toolkit, but they can be tricky to master. A candlestick patterns cheat sheet simplifies the process, helping you make faster and smarter trading decisions. Keep your cheat sheet handy, and soon enough, you’ll start spotting patterns like a pro.

