
When it comes to technical analysis, understanding chart patterns can be a game-changer for your trading strategy. One pattern that you should definitely have in your toolkit is the Descending Triangle. In this post, I’ll walk you through what a descending triangle is, how to identify it, and why it matters in the world of trading.
What is a Descending Triangle?
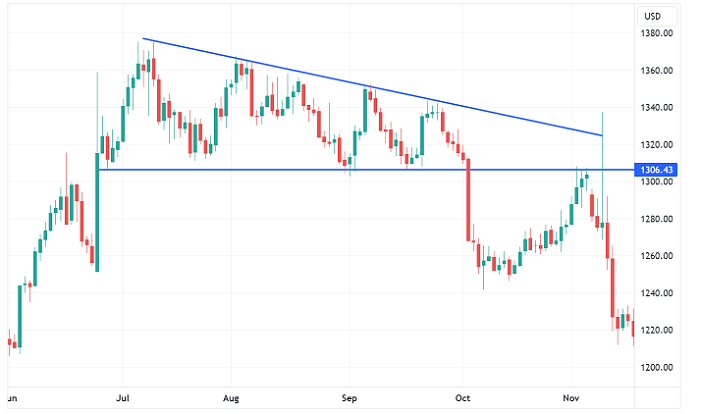
A descending triangle is a bearish continuation pattern that forms during a downtrend. It’s called a “triangle” because the pattern narrows as the price moves sideways. The pattern is characterized by a series of lower highs (the descending line) and a flat support level. In simple terms, imagine the price of an asset bouncing between a downward-sloping resistance line and a horizontal support line. The price keeps getting squeezed tighter and tighter until it breaks out, typically to the downside.
Know more about: Traders Dynamic Index.
How to Identify a Descending Triangle
Spotting a descending triangle on a price chart is relatively straightforward if you know what to look for:
- Lower Highs: The first thing to notice is that each peak is lower than the previous one. This forms the descending trendline.
- Flat Support Level: The lows should form a horizontal line, showing that the price isn’t breaking below a certain level.
- Decreasing Volume: As the pattern progresses, trading volume tends to decrease, indicating a potential breakout is near.
- Breakout Confirmation: The pattern is complete when the price breaks below the flat support level with increased volume. This is usually seen as a signal to enter a short position.
Why the Descending Triangle Matters
The descending triangle is a strong indicator of market sentiment, especially in a downtrend. Traders and investors pay close attention to this pattern because it often signals that the sellers are gaining control, and a significant price drop could be on the horizon.
Here’s why it’s important:
- Predicting Continuation: Since this is a continuation pattern, it suggests that the current downtrend is likely to continue. This can help you align your trades with the prevailing market trend.
- Risk Management: Knowing when a descending triangle is forming can help you set your stop-loss orders and manage your risk more effectively.
- Trading Opportunities: If you catch the breakout early, you can capitalize on the price movement that typically follows a descending triangle.
How to Trade a Descending Triangle
Trading a descending triangle involves a few key steps:
- Wait for Confirmation: Don’t jump in too early. Wait for the price to break below the support level with significant volume.
- Enter the Trade: Once the breakout is confirmed, you can enter a short position.
- Set Your Stop-Loss: Place your stop-loss order just above the last lower high to protect yourself if the breakout fails.
- Take Profit: You can set your take-profit order based on the height of the triangle. For example, if the triangle is $10 tall, you might aim for a $10 drop after the breakout.
Final Thoughts
The descending triangle is a powerful pattern that can help you make informed trading decisions. By understanding how it forms, what it indicates, and how to trade it, you can better navigate the markets and improve your trading results. Always remember to use this pattern in conjunction with other technical indicators and market analysis to maximize your chances of success.