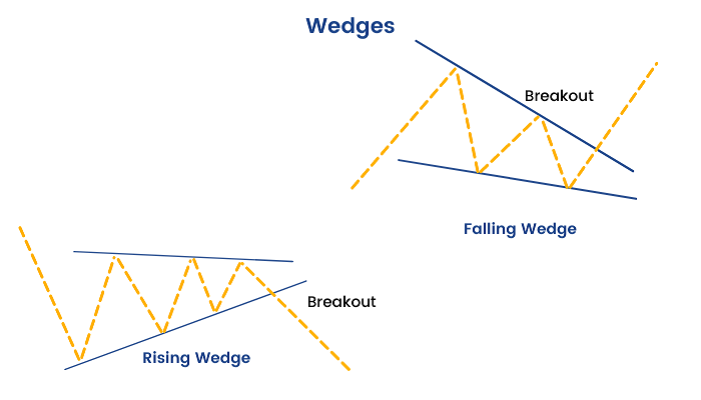
In technical analysis, the falling wedge pattern is a useful tool for traders to predict potential price movements. This pattern, often used in stock and forex markets, can signal a reversal or continuation of the trend. Here’s a detailed look at the falling wedge pattern and how to use it effectively.
What Is the Falling Wedge Pattern?
The falling wedge pattern is a technical chart formation characterized by a narrowing price range. It occurs when the price makes lower highs and lower lows, converging towards a point. This pattern typically indicates a potential reversal or continuation of the trend.
Know more about: Fantasy Football Trade Value Chart.
Key Characteristics of the Falling Wedge Pattern
- Shape: The pattern resembles a wedge that slopes downward, with both the upper and lower trend lines converging.
- Trend Lines: The upper trend line connects lower highs, while the lower trend line connects lower lows.
- Volume: Trading volume usually decreases as the pattern progresses, reflecting reduced market activity.
Types of Falling Wedge Patterns
- Bullish Falling Wedge: This occurs during a downtrend and indicates a potential reversal to the upside. The price is expected to break out above the upper trend line, signaling a bullish trend.
- Bearish Falling Wedge: This happens during an uptrend and suggests a potential reversal to the downside. The price is expected to break below the lower trend line, signaling a bearish trend.
How to Identify a Falling Wedge Pattern
- Downtrend Context: Ensure that the falling wedge pattern forms within a downtrend for a bullish signal, or within an uptrend for a bearish signal.
- Drawing Trend Lines: Identify and draw the upper and lower trend lines connecting the respective highs and lows. Both lines should converge towards the point of breakout.
- Volume Analysis: Look for a decrease in trading volume as the pattern develops, which confirms the pattern’s validity.
Trading the Falling Wedge Pattern
- Entry Point: Enter a trade when the price breaks out of the falling wedge pattern. For a bullish falling wedge, enter when the price breaks above the upper trend line. For a bearish falling wedge, enter when the price breaks below the lower trend line.
- Stop Loss: Place a stop loss just below the lower trend line for a bullish pattern or just above the upper trend line for a bearish pattern to manage risk.
- Target Price: Measure the height of the wedge at its widest point and project this distance from the breakout point to estimate the potential price target.
Example of the Falling Wedge Pattern
Bullish Example: Suppose a stock is in a downtrend and forms a falling wedge pattern. The stock makes lower highs and lower lows, converging towards the point where the price breaks above the upper trend line. This breakout suggests a potential reversal to the upside, making it a buying opportunity.
Bearish Example: Conversely, if a stock in an uptrend forms a falling wedge pattern, making higher highs and higher lows that converge downward, a breakout below the lower trend line indicates a potential reversal to the downside, signaling a selling opportunity.
Conclusion
The falling wedge pattern is a valuable tool in technical analysis for predicting potential reversals or continuations in the market. By recognizing the pattern’s characteristics, understanding its implications, and applying effective trading strategies, you can enhance your trading decisions and manage risks more effectively. Whether you’re a seasoned trader or just starting, mastering the falling wedge pattern can provide significant insights into market movements.

