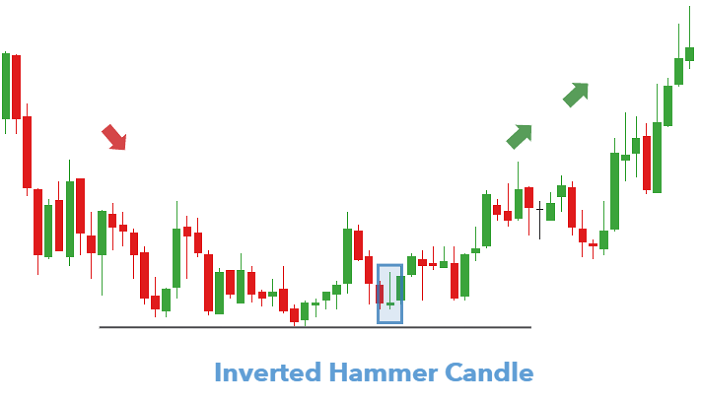
In the world of trading, recognizing candlestick patterns is essential for making informed decisions. One important pattern to be aware of is the Inverted Hammer. This candlestick pattern can signal a potential reversal in a downtrend, offering traders a clue that the market might be about to turn around.
What is an Inverted Hammer Candle?
An Inverted Hammer is a single candlestick pattern that typically appears after a downtrend. It’s characterized by a small body, a long upper shadow, and little to no lower shadow. The candle resembles an upside-down hammer, hence the name.
How Does an Inverted Hammer Form?
The Inverted Hammer forms when:
- Market Opens Low: The trading session begins near the lower end of the day’s range.
- Price Rises Significantly: Buyers push the price higher during the session, creating a long upper shadow.
- Close Near Opening Price: Despite the upward movement, sellers bring the price back down, closing near the opening price, resulting in a small body.
What Does the Inverted Hammer Indicate?
The Inverted Hammer suggests that while the market was dominated by sellers (hence the ongoing downtrend), buyers are starting to step in. The long upper shadow shows that buyers attempted to push the price higher, even though sellers regained control by the close. This pattern signals that the downtrend might be losing momentum, and a reversal could be on the horizon.
Key Characteristics of the Inverted Hammer
- Location: It appears at the bottom of a downtrend.
- Candle Body: Small, indicating the closing price is close to the opening price.
- Upper Shadow: Long, at least twice the length of the body, showing the high buying pressure.
- Lower Shadow: Minimal or absent, reflecting little downward movement.
Trading with the Inverted Hammer
When you spot an Inverted Hammer, it’s essential to confirm the reversal before making a trade:
- Wait for Confirmation: Look for the next candle to close higher, indicating that the buyers are gaining control.
- Place a Stop-Loss: Set a stop-loss just below the low of the Inverted Hammer to manage risk in case the reversal fails.
- Enter the Trade: If confirmation occurs, consider entering a long position (buying) to capitalize on the potential uptrend.
Example of the Inverted Hammer in Action
Imagine a stock that’s been in a steady decline, and then you notice an Inverted Hammer forming. The stock opens at $45, rises to $50 during the day, but then closes at $46. The long upper shadow indicates strong buying pressure. If the next day’s candle closes higher, it might confirm a reversal, presenting a buying opportunity.
Conclusion
The Inverted Hammer is a valuable pattern in technical analysis, especially for traders looking to identify potential reversals in a downtrend. However, it’s important to use this pattern in conjunction with other indicators and wait for confirmation before taking action. Recognizing and understanding the Inverted Hammer can enhance your trading strategy and help you make more informed decisions.

