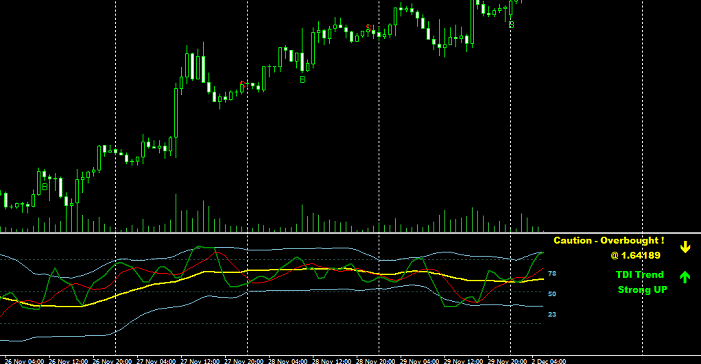
As a trader, having the right tools in your arsenal can make all the difference between success and failure. One of the most versatile and powerful tools I’ve come across is the Traders Dynamic Index (TDI). If you’re looking to enhance your trading strategy, understanding the TDI could be a game-changer. Let’s explore what the TDI is, how it works, and why it might become your go-to indicator.
What is the Traders Dynamic Index (TDI)?
The Traders Dynamic Index (TDI) is a comprehensive trading indicator that combines several elements into a single tool. It helps traders analyze market conditions, spot potential trends, and make informed decisions. The TDI incorporates:
- Relative Strength Index (RSI): Measures the speed and change of price movements.
- Moving Averages: Smooth out price data to identify trends more clearly.
- Bollinger Bands: Provide a relative definition of high and low prices.
By blending these components, the TDI offers a well-rounded view of market momentum, trend direction, and volatility, making it a favorite among many traders.
Know more about: Phillies Trade Rumors.
How Does the Traders Dynamic Index Work?
The TDI consists of several key lines that you need to understand:
- RSI Price Line (Green Line): This line shows the RSI, indicating overbought or oversold conditions. When the green line crosses above the yellow line, it might signal a potential buy. Conversely, when it crosses below, it could signal a sell.
- Signal Line (Red Line): The signal line acts as a trigger for buy or sell decisions. It smooths out the RSI and helps identify potential trade opportunities.
- Market Baseline (Yellow Line): This line represents the overall market direction. It’s the middle ground that shows the long-term trend.
- Bollinger Bands (Blue Lines): These lines show volatility by measuring the price deviation from the market baseline. When the bands widen, the market is volatile; when they narrow, the market is calmer.
Why Use the Traders Dynamic Index?
The TDI is popular for several reasons:
- Versatility: The TDI works in any market—stocks, forex, commodities, or cryptocurrencies. Its multi-dimensional approach provides valuable insights across different trading environments.
- Ease of Use: Despite its complexity, the TDI is user-friendly. Once you understand the components, reading the TDI becomes intuitive, allowing for quicker decision-making.
- Trend Confirmation: The TDI helps confirm trends and potential reversals. It’s particularly useful in volatile markets, where false signals can lead to losses.
- All-in-One Indicator: Instead of using multiple indicators separately, the TDI provides a holistic view, combining RSI, moving averages, and Bollinger Bands into one.
How to Trade with the Traders Dynamic Index
Trading with the TDI involves a few key steps:
- Identify the Trend: Look at the yellow Market Baseline. If the green RSI line is above the yellow line, the market is likely in an uptrend. If it’s below, the market may be in a downtrend.
- Look for Crossovers: Pay attention to where the green RSI line crosses the red signal line. A crossover above the signal line can indicate a buy signal, while a crossover below might suggest a sell.
- Check Volatility: Observe the Bollinger Bands. If they’re widening, the market is experiencing higher volatility, which could affect your entry or exit points.
- Set Entry and Exit Points: Use the TDI to set clear entry and exit points based on the crossovers and trend direction. This helps in minimizing risks and maximizing profits.
Final Thoughts
The Traders Dynamic Index is more than just another indicator—it’s a comprehensive tool that can significantly enhance your trading strategy. Whether you’re a beginner or an experienced trader, the TDI offers valuable insights into market trends, momentum, and volatility. By mastering the TDI, you can make more informed decisions, reduce your risks, and ultimately improve your trading performance.

